Designing Experiments
Need help designing your experiment?
Reach out in #ask-experimenter on Slack or attend an office hours session.
An experiment is a controlled test that measures the impact of a change by comparing two or more groups of users. Unlike rollouts (which deliver features) or Firefox Labs (which gather qualitative feedback), experiments are designed to produce statistically significant, quantitative results — they tell you whether and how much a change affects user behavior.
When to use an experiment
- You want to measure the causal impact of a feature or change on specific metrics.
- You need to compare multiple approaches (A/B or A/B/C testing) to decide which one to ship.
- You want data science support with statistical analysis and a results dashboard.
- You need to make a data-informed decision before committing to a broader rollout.
When not to use an experiment
- Use a rollout instead if you've already decided to ship a feature and just need to deliver it incrementally to manage risk. Rollouts don't have a control group or produce analysis results.
- Use Firefox Labs instead if the feature is early-stage and you want qualitative feedback from opt-in early adopters before it's ready for a broader audience.
How experiments work
Experiment lifecycle
- Design — Define your hypothesis, metrics, and audience
- Configure — Set up the experiment in Experimenter with branches, feature configuration, and targeting
- Review — Submit for review and approval
- Live (Enrolling) — Users matching your targeting criteria are randomly assigned to branches
- Live (Observation) — Enrollment closes and you wait for data to accumulate
- Complete — End the experiment
- Analysis — Statistical analysis runs automatically and results appear in Experimenter
Key concepts
- Branches — Each experiment has at least two branches: a control (unchanged experience) and one or more treatments (the changes you're testing). Users are randomly assigned to a branch.
- Enrollment period — The window during which new users can be assigned to the experiment. Defaults to one week, to capture a balanced sample across all days of the week.
- Observation period — After enrollment closes, the period during which you collect data. Defaults to three weeks, for a total experiment duration of four weeks.
- Sizing — How many users you need in each branch to detect a meaningful difference. Work with your data scientist to determine this.
Designing your experiment
1. Start with a hypothesis
The best experiments start with a clear question you want answered and a hypothesis about what you expect to happen. A good hypothesis takes the form:
If we [make this change] for [specific users], then we will see [outcome].
We believe this because we have observed [observations] through [data source, user research, surveys, previous experiments, etc.].
For example: "If we move the bookmark button to the toolbar, we expect to see an increase in bookmark usage. We believe this because user research shows users have difficulty finding the current bookmark action."
This gives you a testable prediction, a clear metric to measure, and a basis for deciding what to do with the results. If you don't have a specific question an experiment can answer, consider whether user research, market research, or a Firefox Labs experience might be a better fit.
2. Define success metrics
Before you build anything, decide how you'll know if your hypothesis is correct:
- Primary outcomes — The key outcomes you're trying to move (e.g., bookmark usage, engagement, retention). You can select up to two primary outcomes per experiment.
- Secondary outcomes — Additional outcomes you want to observe. These don't have a limit but can't overlap with primary outcomes.
- Guardrail metrics — Metrics you don't want to regress (e.g., DAU, search count, ad clicks). These are automatically included in analysis.
- Feature-specific metrics — Specific interactions you want to observe. Link to the relevant telemetry probes in the Glean Dictionary.
- Segments — Do you need to break results down by user type (new vs. existing), locale, or geography? Plan this upfront.
3. Design your branches
Every experiment needs at least two branches:
- Control — The current, unchanged experience. This is what treatments are compared against.
- Treatment(s) — The change(s) you're testing. You can have multiple treatments (A/B/C) if you want to compare several approaches.
For each branch, document:
- What the user will experience
- Screenshots or mockups (if applicable)
- Whether the content needs to be localized
- How to trigger/see the change (so it can be QA'd)
4. Consider your targeting
Think about who should (and shouldn't) be in this experiment:
| Consideration | Questions to answer |
|---|---|
| Application & channel | Desktop? Mobile? Which channel? Avoid targeting multiple channels in the same experiment — each channel has different population sizes and user behavior, which can produce misleading results. |
| Version | What's the minimum Firefox version where the code and telemetry landed? |
| Locales & countries | Does the experiment involve user-facing text that needs translation? |
| Advanced targeting | Do you need to target specific user groups? New users only? Users with a specific preference set? Specific operating systems? |
| Exposure conditions | Does the user need to do something specific to encounter the change (e.g., open a PDF, use accessibility features)? This affects sizing. |
| Exclusions | Should users in other active experiments or rollouts be excluded? |
| Sticky enrollment | By default, users who no longer match targeting criteria will be unenrolled. Enable sticky enrollment if you want users to stay in the experiment even if their targeting attributes change (e.g., locale, version). |
| First-run experiments | Targeting brand-new profiles? Mark the experiment as a first-run experiment and set the proposed release date to align with the Firefox version you're targeting. |
5. Create an experiment brief
Bring all of the above together in an experiment brief. The brief is the single document that captures your hypothesis, success metrics, branch designs, targeting, and risks. It's also where you'll record results and next steps when the experiment completes.
6. File a data science ticket
File a Data Org (DO) Jira ticket (click Create in the header of the page) so a data scientist can help you with experiment sizing, metric selection, and analysis planning.
7. Attend office hours
Come to data science office hours to design and size your experiment. There are several sessions available depending on your needs and where you are in the process.
If your experiment includes any in-product messaging, get a message consult and file an FXE ticket.
Build and de-risk
Once your design is validated:
- Enable your feature for experimentation using the Nimbus feature API. If your feature supports it, add an exposure event so analysis can distinguish users who actually encountered the change from those who were enrolled but never saw it.
- Write your experiment in Experimenter and link to your experiment brief.
- QA your experiment by putting it into Preview and either self-testing or filing a QA Jira ticket.
- Review risks — experiments make remote changes to the experience of live users, often millions of people. Experimenter will ask you to assess risk in several categories: brand risk, messaging risk, partner-related risk, revenue impact, and AI/ML risk. Review and mitigate risks before you launch.
Launch, monitor, learn
- Add sizing information to your experiment if you haven't already.
- Launch by clicking Launch and requesting a reviewer in
#ask-experimenter. - Monitor using Live Monitoring to verify your experiment is enrolling well. Check that you've hit your expected enrollment target before the enrollment period ends.
- Wait for results — Analysis begins automatically about a week after enrollment ends. Results will appear on the experiment's page in Experimenter with both overall and weekly breakdowns.
- Record results — Log your results and next steps in the experiment brief:
- Was your hypothesis correct?
- Were any changes statistically significant?
- Ship it? If it's a win, how do you get it out? Promote to a rollout?
- Kill it? Have you already iterated enough?
- Iterate? Are there positive signals that suggest you can turn this into a win with further refinement?
Iterating on experiments
If your results suggest further refinement, you can clone your experiment in Experimenter to create a new iteration. Cloning preserves your branches, feature configuration, targeting, and outcomes, but resets dates, population percentage, and risk assessments so you can start fresh.
You can also promote a winning branch to a rollout directly from the experiment's Summary page — see Creating a rollout from an experiment.
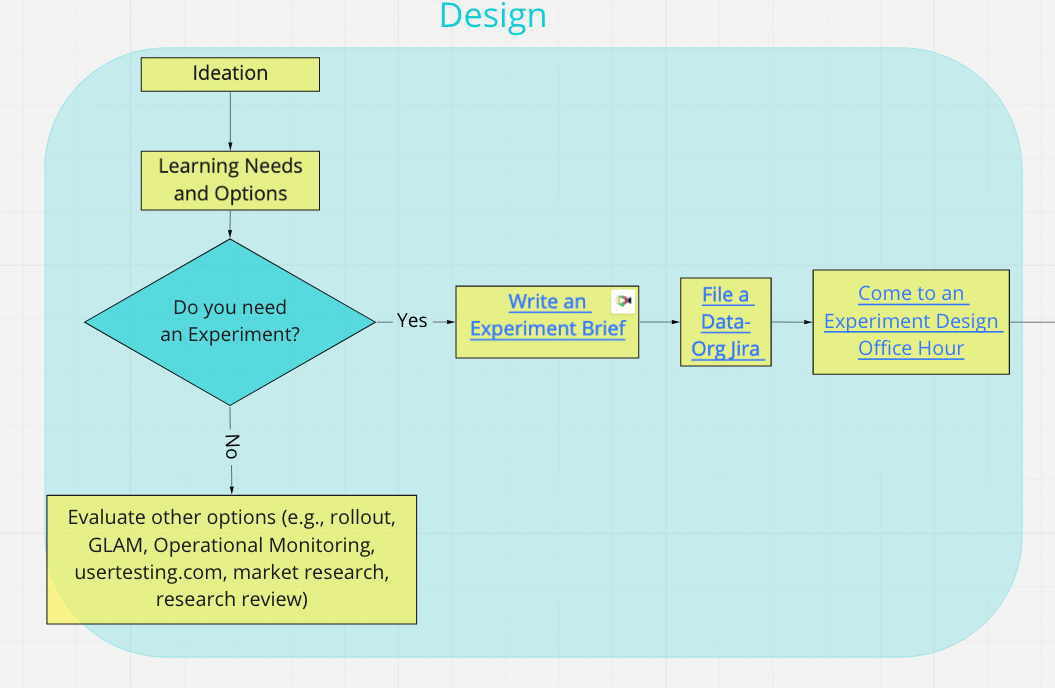
Workflow diagram
For a visual overview of the full experiment workflow, see the live Miro board.
Next steps
Once your experiment design is validated, continue to Configuring to set it up in Experimenter.