Sizing Experiments Using Mozanalysis
This page gives an overview of how Mozanalysis can be used to do experiment sizing. Mozanalysis is a library used to standardize experiment analysis at Mozilla. Mozanalysis contains the statistical tools used by Jetstream to produce results from experiments, as well as tools to pull historical data from BigQuery to calculate necessary sample sizes to carry out experiments. The results of the tool are the sample size and percent of the total target population required per branch of an experiment with a balanced design to achieve a given power.
Experiment sizing paradigm
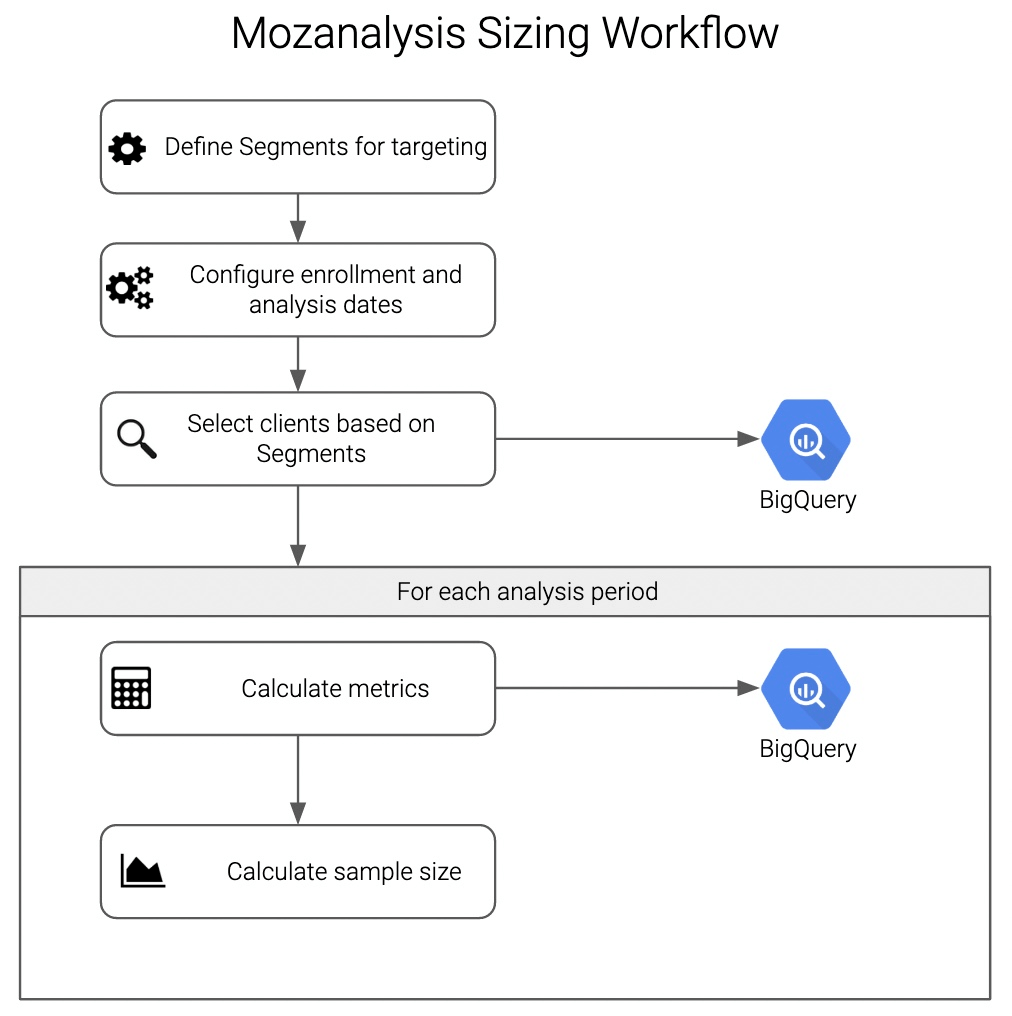
Experiment sizing in Mozanalysis retrieves historical data from BigQuery in a way that mimics how experiment enrollment and analysis is conducted by Jetstream: an enrollment period is defined, during which clients that satisfy certain target conditions are recorded; following enrollment, metrics are calculated for those clients over a defined analysis period. Following collection of metrics, sample size calculation is performed that corresponds to the statistical tests to be used in analyzing the eventual experiment.
Enrollment and analysis
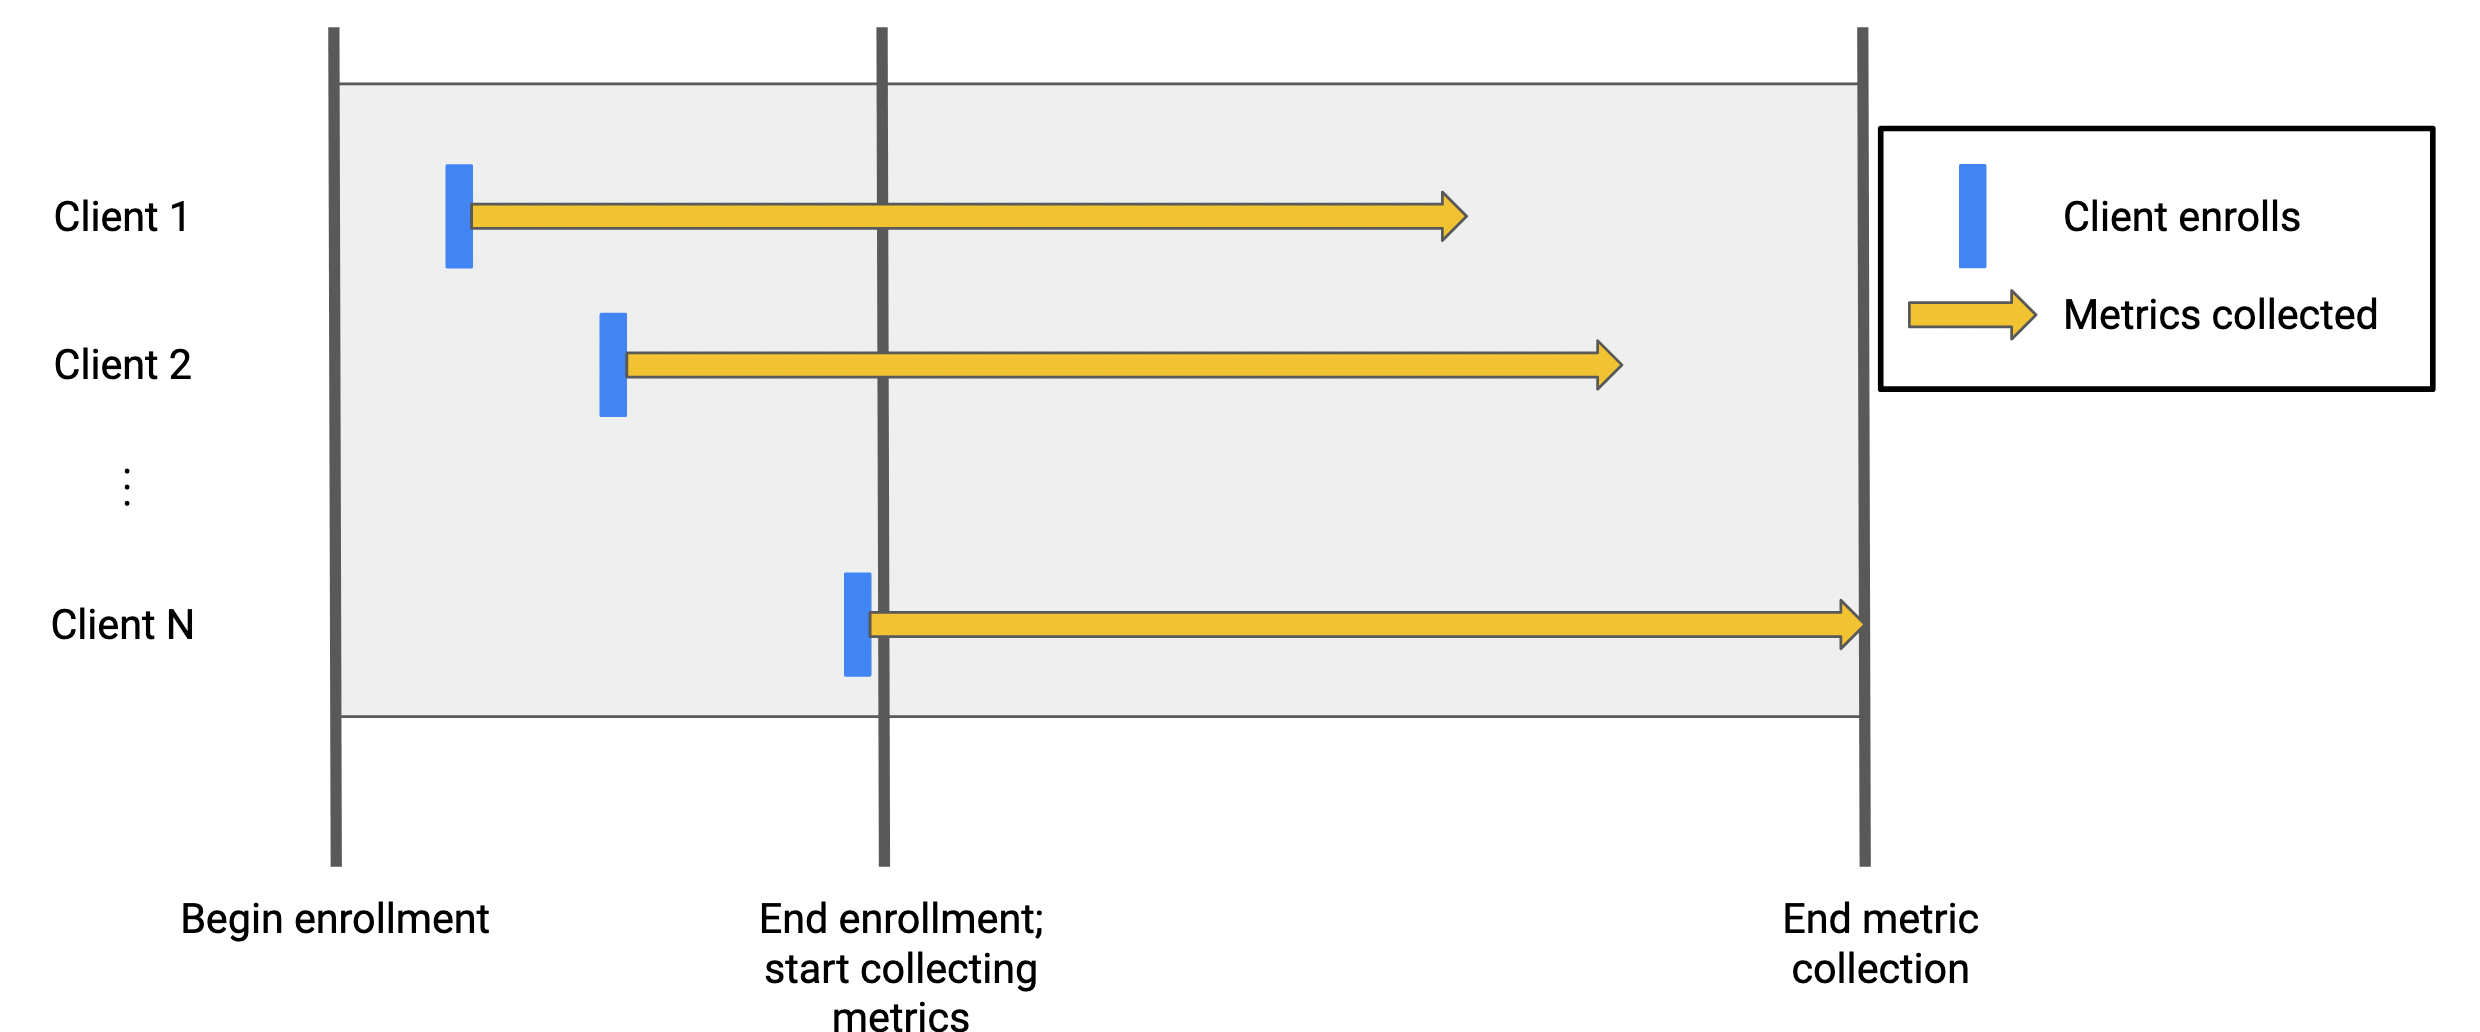
Similar to how experiments use an enrollment period to select clients for a study before collecting metrics for a period of time, Mozanalysis experiment sizing records all clients that satisfy the target conditions during an enrollment period, set by the user based on the analysis start date and the number of dates to enroll. Metrics are then recorded for a user-defined number of days for the analysis.
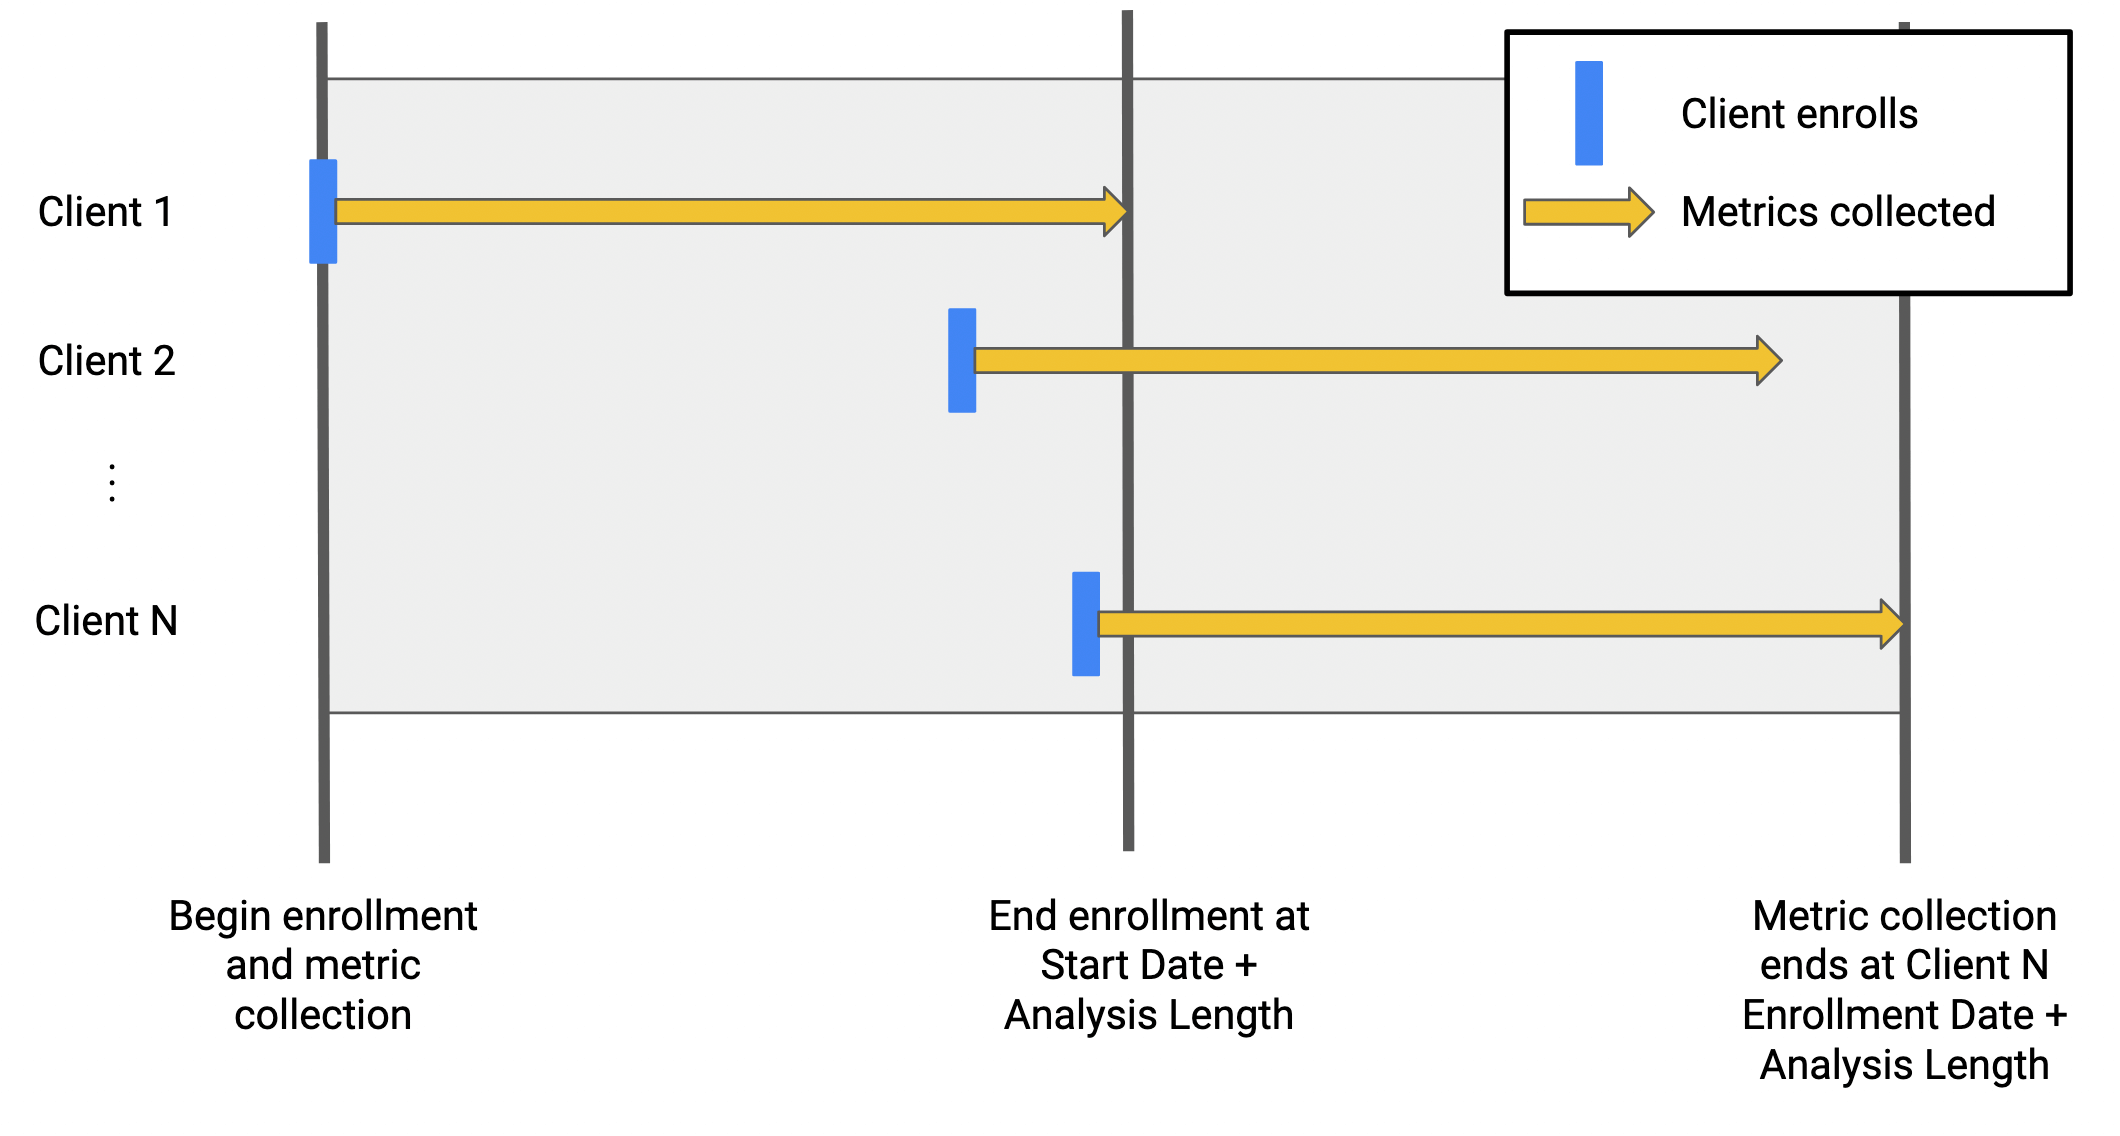
An alternative to using an enrollment period to select clients is to use continuous enrollment, where any client that satisfies the targeting criteria during the entire analysis period is enrolled; metrics are collected from each client's enrollment date to the end of the analysis period.
Time series of metrics
In some cases, experiments will require client-level time series data. Mozanalysis can split the analysis period into time series periods (either daily, weekly, or monthly).
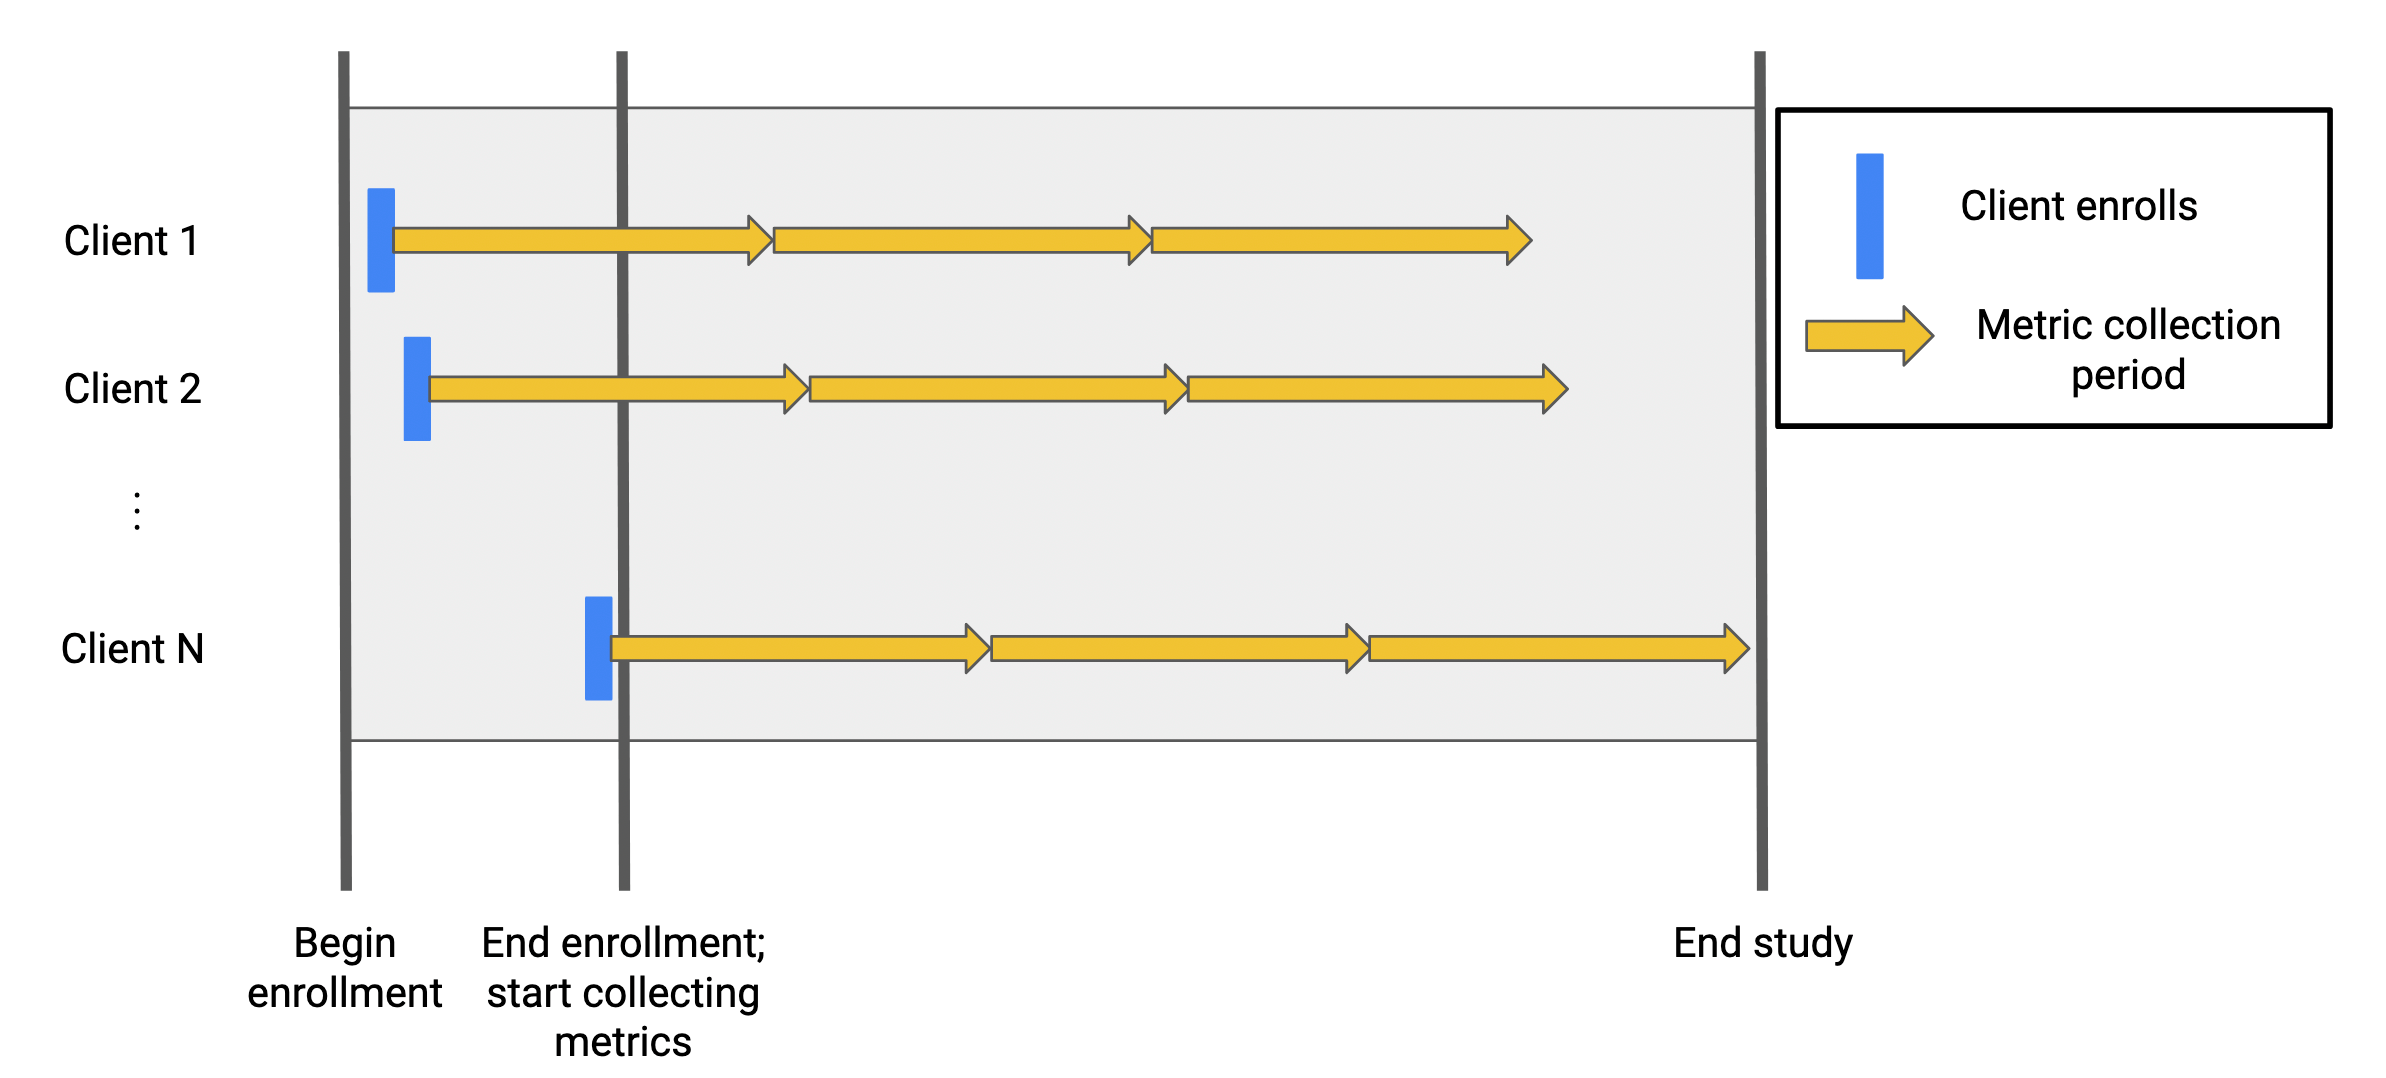
The time series data returned will contain a row for each client for each time series period, so the number of rows in the time series results will be (number of periods) times larger than the results for a single analysis window. Mozanalysis offers a few options to retrieve this data:
- Download the entire set directly: Mozanalysis will warn the user about the approximate size of the data set they will download.
- Download the data in chunks: Analysis periods in the time series are keyed by start dates, and the data for each period can be downloaded separately using this key.
- Calculate aggregated metrics in BQ before downloading: A BQ aggregate function can be used to calculate within-analysis-period statistics before downloading; this will drastically reduce the size of the data, to (number of periods) rows, and is recommended whenever possible.
Targets and metrics
Selecting clients for analysis is accomplished by using the Segment objects in Mozanalysis; users can either reuse segments that currently exist in Mozanalysis or define one at runtime. Segments consist of a data source, either a table or view in BigQuery, and a SELECT expression to filter that data source; this SELECT expression must include a SQL aggregate function.
Similarly, Mozanalysis experiment sizing reuses Metric objects from Jetstream, and users can reuse metrics that are currently implemented in Mozanalysis or in Jetstream configs, or users can define their own at runtime.
Metrics and target segments are passed to Mozanalysis experiment sizing as lists of Segment or Metric objects; users may include multiple of each in the analysis. When multiple Segment objects are used, Mozanalysis identifies clients that satisfy the conditions of all targets in the list. If users would like to run analyses where Segments should be joined with OR rather than AND, multiple experiment sizing tasks should be completed, for each condition in the OR statement, and aggregate the returned results from each separate study.
Implemented sample size calculators
Mozanalysis contains functions that take the results from pulling historical data and the list of metrics contained in the results and produce sample size estimates for each metric, given the desired power, significance level, and relative effect size expected from the change, a percent change in a statistic of the metric. The tests in Mozanalysis will return the required sample size per branch of the experiment; these sample sizes assume the experiment has two branches and that each branch will have an equal number of clients enrolled in the experiment. The following tests have sample size calculators implemented:
- Z or T test for difference in means for independent samples
- Z test for difference in proportions for independent samples
- Test for difference of Poisson rates
- Empirical effect size Wilcoxen-Mann-Whitney U test, based on an effect size calculated as the 90th percentile of week-to-week changes in the metric
Example Colab notebooks
- Example with explanations for setting up sizing for a simple experiment (link)
- Replicating the sizing for the MR holdback (link)
- Sizing a mobile experiment (link)
- Replicating sizing for Waldo, which uses continuous enrollment (link)
- Pulling time series historical data and sizing with empirical sample size calculation (link)