Overview
Jetstream is an analysis framework for experiments. Jetstream aggregates and summarizes product telemetry, using the experiment definitions in Experimenter, to produce the datasets that drive the results dashboards.
Most investigation owners will not interact with Jetstream directly. Jetstream computes a default set of statistics for every experiment. Investigation owners can add additional metrics to a results dashboard by choosing outcomes in Experimenter while designing an experiment.
Data scientists can extend Jetstream with new outcomes by contributing
outcome definitions
to the jetstream/ directory in the metric-hub repository.
Data scientists can also ask Jetstream to evaluate custom metrics for a particular experiment by contributing experiment configurations to metric-hub.
Jetstream is not a monitoring platform, which means that Jetstream does not emit real-time results. The first interesting results will usually be available a week after the enrollment period ends. Typically, that means results will begin to appear two weeks after the day the experiment launches.
Analysis paradigm
Experiments are analyzed using the concept of analysis windows. Analysis windows describe an interval marked from each client’s day of enrollment. The “day 0” analysis window aggregates data from the days that each client enrolled in the experiment. Because the intervals are demarcated from enrollment, they are not calendar dates; for some clients in an experiment, day 0 could be a Tuesday, and for others a Saturday.
The week 0 analysis window aggregates data from each client’s days 0 through 6, the week 1 window aggregates data from days 7 through 13, and so on.
Clients are given a fixed amount of time, specified in Experimenter and often a week long, to enroll. Final day 0 results are available for reporting at the end of the enrollment period, after the last eligible client has enrolled, and week 0 results are available a week after the enrollment period closes. Results for each window are published as soon as complete data is available for all enrolled clients.
The "overall" window, published after the experiment has ended, is a window beginning on each client’s day 0 that spans the longest period for which all clients have complete data.
Enrollment vs exposure
Enrollment and exposure are two separate steps in the experiment lifecycle. All experiments have enrollment events; some experiments have exposure events.
Enrollment happens when a Firefox client receives a recipe, evaluates the targeting expression, and decides to enroll in the experiment.
Exposure occurs at the earliest moment at which a user would encounter a different experience in different branches of the experiment.
Not all enrolled users will be exposed, though all exposed users must have been enrolled. Calculating metrics based on enrolled users will tell us what the effect on our KPIs for the targeted segment would be if we deployed the treatment to everyone. Calculating metrics based on exposed users helps us understand whether we had an effect on the users we were able to reach. Using an exposure basis for our analysis helps us understand if we are having an interesting effect on a small population.
For example, consider an experiment on the Picture in Picture feature. PiP displays a small icon when users hover their mouse over an eligible video. If a user never visits a page with an eligible video, the experiment cannot have any effect on them. Two reasonable choices for exposure events could be the moment that a page is loaded with an eligible video, or the moment that the PiP overlay icon is first displayed.
Any telemetry collection can be used as an exposure event, though events are often especially useful.
Many Nimbus features will send a Nimbus exposure event automatically when the feature configuration is consulted;
these are normandy#expose events on desktop and nimbus_events.exposure events in Glean.
Analysis steps
When analyzing experiments, the following steps are executed for each experiment:
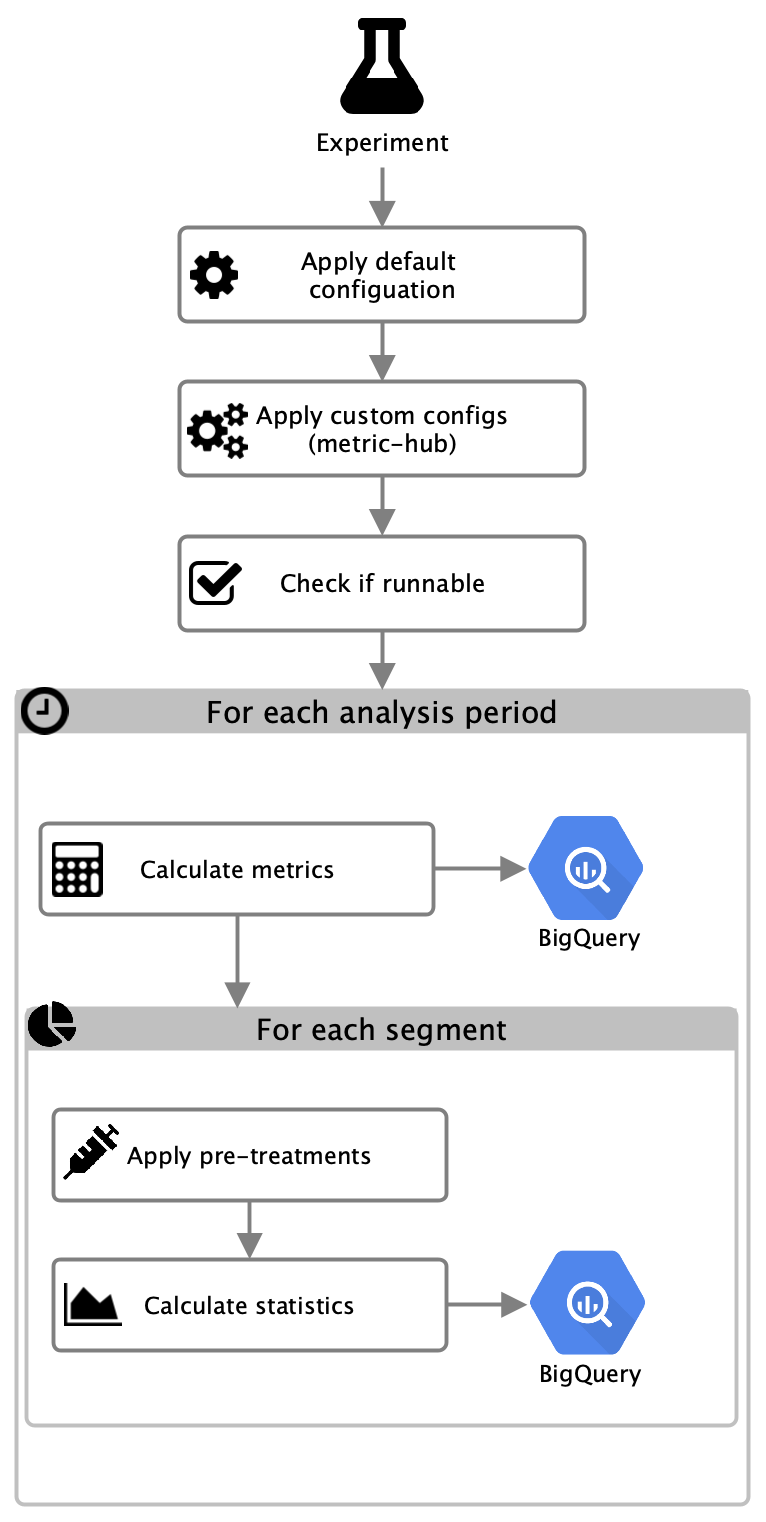
A default configuration
which depends on the experiment type and, if defined, a custom configuration
provided via the jetstream/ directory in the metric-hub repository are parsed and used for analysis.
The experiment definition and config parameters are used to run some checks
to determine if the experiment can be analyzed. These checks include, for example,
validating start dates, end dates and enrollment periods.
If the experiment is valid, then metrics are calculated for each analysis period (daily, weekly, 28 days, overall) and written to BigQuery. Metrics are either specified or a reference to existing metrics defined in mozanalysis is provided in the configuration files. Next, for each segment, first pre-treatments are applied to the metrics data which is then used to calculate statistics. Statistics data is written to BigQuery and later exported to GCS as JSON.
Tooling and metric versioning
Jetstream ensures that results get computed consistently across the entire analysis duration of an experiment. It prevents sudden changes of how results are computed after tooling (such as mozanalysis which Jetstream depends on) or default metrics get updated by using the same versions as when the analysis initially started until the experiment completes.
How to use the latest tooling and metric definitions?
When tooling or metrics are updated, there are a few options with different consequences for how Jetstream treats existing experiments:
- do nothing: only experiments that are launched after the new tooling release will use the most recent version of the tooling
- use new tooling version without rerunning: install the jetstream command line tooling locally and run
jetstream rerun-skip --experiment_slug=<slug>. This command pretends to rerun the experiment without actually re-running the queries, which will update the date used to determine which tooling and metric versions to use. Rerunning an experiment will always force new versions to be used for experiments. - rerun experiment: re-running an experiment will always use the most recent version of the tooling on the rerun and update the last updated timestamps of the result tables
More detailled information around versioning is available in Jetstream Operations.
Datasets
The datasets that back the Experimenter results dashboards are available in BigQuery. Technical documentation is available in the Mozilla data docs.