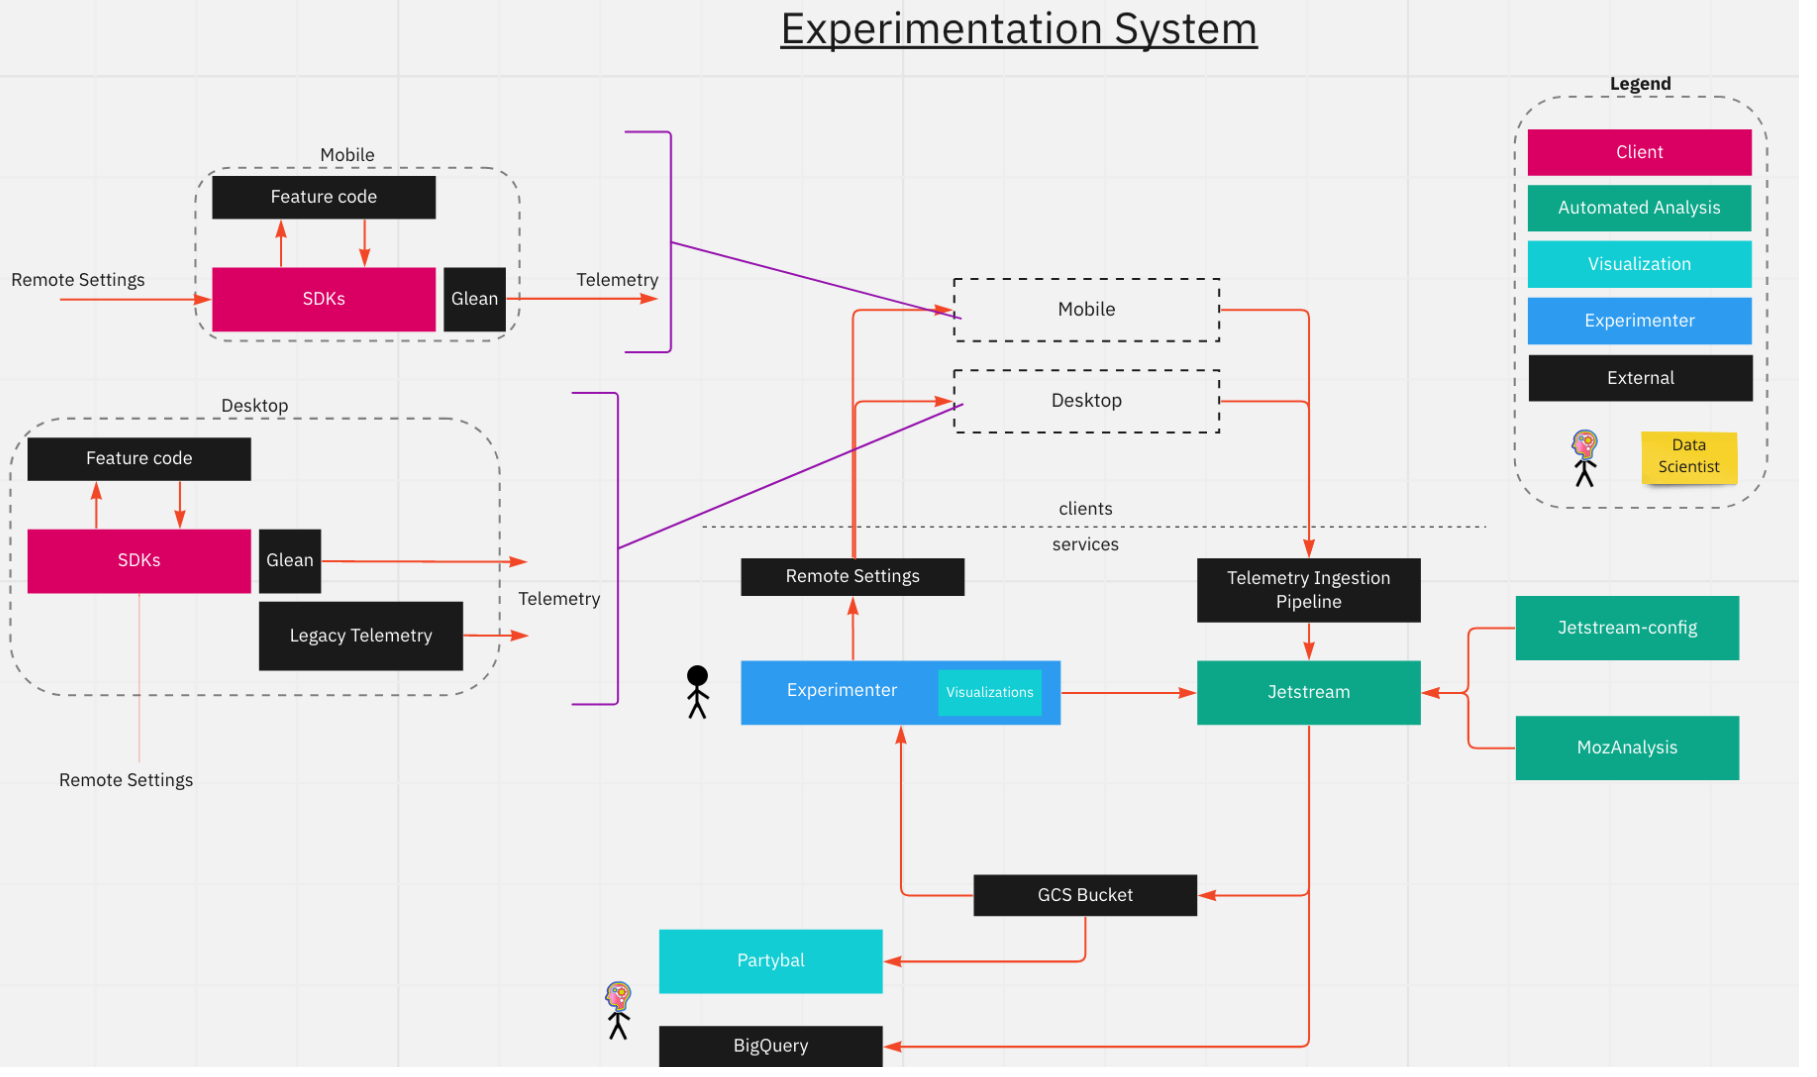
System architecture / components
 [original lives here](https://miro.com/app/board/uXjVOkkueZY=/)
Experiment Configuration
Experimenter (AKA Nimbus Console)
This is the interface used by experiment owners and reviewers to capture details about the experiments and the specifics about how to launch it.
This is the interface to start, end enrollment, end, and look at results.
stage and production
Remote Settings
This is a shared service at Mozilla - that is used to remotely configure the clients. This is the means of applying experiment changes to the client off-train.
Client Side
SDK
Each of the Firefox platforms has an SDK that handles all the experiment operations of targeting, enrolling, bucketing, etc.
The SDK talks to Remote Settings to get the experiment configurations and changes.
Telemetry
The SDK also generates telemetry on the clients participation in the experiment (state of enrollment, branch, unenrolls).
This and the client telemetry use the applications existing Glean or Legacy Telemetry pipeline.
Analysis
Automated Analysis System (AKA Jetstream)
Jetstream runs nightly to automatically analyze the metrics for experiments.
It runs some metrics for every experiment (varies by platform) and can run additional metrics if there are custom configuration files applied to the experiment.
Custom Configuration (AKA Jetstream Configuration Files)
A data scientist can write a custom configuration file named after the slug of the experiment to add metrics to an experiment.
Analysis library (MozAnalysis)
Only interfaced with through the data team - this is a repository of vetted metric formulas that can be applied when needed by Data Scientists.