Validating Experiments
This section describes some common problems with experiments that you should look out for, how we recommend testing for them, and some potential causes to investigate if you do see that something is wrong.
You should consider this a starting point, not a comprehensive list. Generally speaking, interesting results warrant a higher degree of scrutiny.
Branch imbalance (Sample Ratio Mismatch)
We expect to see some variation between the observed v.s. expected ratios for enrollment in branches for experiments. However, too much imbalance might be indication that there might be a problem with the validity of the experiment configuration, implementation, or execution.
As a first step, you should continuously monitor daily active population and enrollment by branch to see if anything is obviously wrong. We do this with standard Grafana monitoring dashboards generated for every experiment:
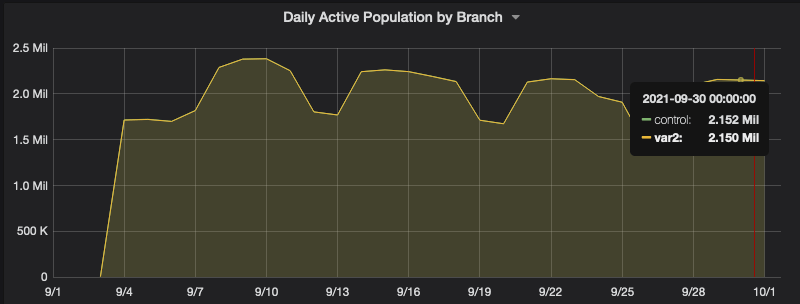
You will also see a "Sample Ratio Mismatch" health check, which is a chi-squared test of independence to determine whether the difference between the actual v.s. expected ratio of branches is statistically significant. Note that this can have some temporary fluctuation, but you see a sustained period of enrollment for which the p-value is less than 0.01, you should consider this cause for further investigation.

You will see SRM checks for daily active clients, enrollments, and unenrollments. Note that it is always important for enrollments to be balanced, whereas noise in unenrollments is less concerning. Some potential causes of SRM if you do see a potential issue:
- Low overall enrollment
- High unenrollments in treatment due to implementation details of the experience being tested
- Irregularities in deployment of experiments/updating in flight
Low enrollments
Once your experiment has been enrolling for a day or so, you should check your monitoring dashboards to see the difference between the actual and expected rate of enrollment. If numbers are lower than expected, this can be due to:
- An error in sizing calculations (your expected count was off)
- The experiment conflicts with other experiments or roll-outs targeting the same feature
- Misconfiguration in experimenter (e.g. you selected the wrong release version or channel)
- A bug in server-side targeting expressions
- A bug, timeout, or implementation error in client-side targeting attributes;
- You launched the experiment during the first week of a new release, during which actual users are still updating to the latest version of Firefox
High unenrollments
Users can be removed from experiments for a number of reasons, which shows up on your dashboard as "unenrollments". When unenrollments look suspiciously high, these are some possible causes to investigate:
- A targeting condition that was true during enrollment is no longer satisfied (e.g. user switched regions)
- A preference that is required for the experiment to be on was changed by the user
- Infrastructure failures (e.g. signing, remote settings delivery is somehow compromised)
- Users are opting out of the experiment at an unexpected rate
Debugging unenrollments by reason
In order to see which "reasons" are responsible for unenrollment, you can take a look at this part of the dashboard:

Alternatively, you can run your own query for unenrollment events. For example, this will show you unenrollments by reason and branch:
SELECT
    submission_date,
    mozfun.map.get_key(event_map_values, 'branch') as branch,
    mozfun.map.get_key(event_map_values, 'reason') as reason,
    COUNT(*) AS events
FROM telemetry.events
WHERE
    event_category = 'normandy'
    AND event_method = 'unenroll'
    AND event_string_value = 'YOUR_EXPERIMENT_SLUG'
    AND submission_date >= '2021-8-10'
GROUP BY 1, 2, 3
ORDER BY events DESC